Showing posts with label gases. Show all posts

Friday, 27 January 2017

Volcano monitoring from a distance

In the past few weeks, there has been an eruption that keeps littering my inbox with emails: Bogoslof Volcano, on a tiny island of roughly 1 by 2 km out in the Bering Sea, west of the Alaska Peninsula.

View from a helicopter onto Bogoslof Island. Photo: Dan Leary, Maritime Helicopters
Despite the fact that it's effectively in the middle of nowhere (the nearest town is roughly 100 km away), Bogoslof is an interesting one. Being up in the Aleutian Chain, it sits along a very important corridor for international air traffic. If you remember the chaos all over Europe after the 2010 eruption of Eyjafjallajökull in Iceland, it's hardly surprising that monitoring volcanoes even in parts of the world as remote as Alaska is an important task. But how do you monitor a volcano that sits on an uninhabited, far away island?

An obvious answer would be to put a bunch of instruments onto the island. However, the island is so small, so far away from any population, in such a harsh environment, that the Alaska Volcano Observatory has to focus its limited resources elsewhere. In addition, the last eruption previous to this one had occurred in 1992, and it's been at least 40 years since the last eruption before that, so unsurprisingly the volcano was relatively low on the monitoring priority list.

This changed on 20th December 2016, when several pilots in the area reported an ash cloud that had risen up to over 10 km above sea level. Because there is so much air traffic going through the region, reports like that are an important part of monitoring volcanic activity in remote areas. Whereas the eruption had stopped within an hour or two, activity at the Alaska Volcano Observatory certainly wouldn't have.

Data had to be analysed, statements had to be published and scientists were looking for signs of any unrest that may have preceded the eruption. Indeed, looking back through the data, the volcanologists realised that Bogoslof had been showing signs of activity throughout the month of December, and the first explosion may have occurred as early as 16th December. So what kind of data can volcanologists use to monitor Bogoslof?

Even though there are no seismometers on the island itself, nearby Okmok and Makushin volcanoes have extensive monitoring networks. Because seismometers are very sensitive instruments, and volcanic eruptions make the ground shake with waves that can travel a long way, it is actually possible to look at seismic signals from Bogoslof on other islands.

Similarly, microphones recording "infrasound" (i.e. sound at frequencies much lower than the range we can detect with our ears) can detect pressure signals coming from far away, and volcanic eruptions often produce distinct infrasound.

Satellite image show the ash cloud at Bogoslof Volcano on 18th January 2017. Image: NASA Earth Observatory/Jeff Schmaltz

Satellites are also quite useful. A volcanic ash cloud can often be detected from space. Some satellites capture light of many different wavelengths, others can detect different types of gases in the atmosphere, some of which can be traced back to volcanoes. Visual observations by pilots, local residents or fishermen help to complement the picture we get from satellites.

Last but not least, volcanic lightning (i.e., lightning strikes in or around the ash cloud coming up in an eruption) has been an increasingly valuable tool to detect volcanic eruptions over the last few years. Volcanic lightning is still not fully understood and subject to active study by volcanologists around the world, but even without a complete understanding of the exact mechanism it is a spectacular sight and can be used for eruption detection. You can watch lightning happen all around the world through the World Wide Lightning Location Network if you're interested, almost in real time.

Spectacular eruption with volcanic lightning at Mt. Etna, Italy. Photo: Karl-Ludwig Poggemann

At the time of writing this post, Bogoslof continues to have explosions every few hours to days, and scientists are analysing these eruptions through all the different types of data mentioned above, even though there are no instrument directly on the volcano. Pretty amazing, isn't it?

Sunday, 25 October 2015

Like a box of chocolates

Sometimes studying volcanoes is similar to what Forrest Gump told us about life: You never know what you're gonna get.
Yesterday we had our Vancouver Volcano Studies Group meeting. Basically, this group consists of a bunch of people in Vancouver doing volcano related research, or people who are just somehow affiliated with one of us and interested in the topic. This time, we decided to have a once-a-term mini-conference. A bunch of us gave talks about our volcano-y research, and I was pretty blown away. I mean, I'm a volcanologist, so surely I know about most of the methods we use to study volcanoes, right? Incorrect. There are so many cool ways we can study volcanoes that people talked about yesterday, it was really fascinating. And the best part? Some methods can be done by anyone! Citizen scientists, we need you!
So let me give you some examples.

  1. Drones! This is of course a buzz word at the moment, but turns out they can really help us to learn about our volcanic neighbours. Drones are good, because they don't care too much if a volcano erupts a bunch of gases that might not be great for human health - at least if you don't leave the drone sitting in those gases for days or weeks at a time. Also, with drones we can cover a lot of ground in a short amount of time, and get to see places that otherwise we might never get to. That means we can fly a drone over a lava lake, or some other potentially dangerous part of the volcano, and get video footage without having to risk our lives. Yay! You can also mount all sorts of cool equipment on a drone, depending on how big the equipment is and how strong/stable the drone is. I'm thinking, maybe small gas sensors, or a thermal camera? 
  2. Lasers! Ok, this sounds tacky, but seriously. There is a technique called "Lidar", which means you shoot a laser pulse at something, it bounces off, comes back to your sensor, and you can measure the time it takes, and maybe some other things about the returning pulse. We can cover whole areas with those Lidar measurements, and that way reconstruct the surface that we were scanning, in 3D! Certain properties about the returning waves might even give us some information about the material we were scanning. That means, without having to go there, we can scan surfaces and observe how they are changing over time. For example, we can learn about lava lake explosions when rocks fall into the lake from the walls. How? We measure the volume of rock lost into a lava lake in a rock fall, by comparing the Lidar scans from before and after, and we can of course measure the height of the explosion from the lava lake, or some other property. That way we can learn about potential processes happening underneath the surface of the lava lake during the rock fall, or at the very least we can know for next time when a rock fall happens how big the explosion might get.
  3. This is maybe the coolest one, cause it's so simple that anyone can do it: Photos! If you take lots of photos of the same object from different angles, there is software that can create a 3D image of your object. That way we can get detailed models of areas that are too difficult or too dangerous to get to, just like with drones. Even better if we can combine the two somehow, drones and photos. We could study the surfaces of the rock on a high peak, for example, and learn about how they formed, or we could get the change of time of the surface of a growing lava dome at really high detail - maybe this can tell us when a collapse of the dome may be happening soon? Of course there are lots of calculations and conditions that need to be met for this to work, but in theory anybody could do this! If you're an avid climber or mountaineer, you might be able to help us study some of the old volcanic peaks by taken photographs of them from certain angles during your trips, and submitting them to some sort of central repository afterwards - so you get to contribute to science while doing your favourite outdoor activities, isn't that cool?!
I realized during the meeting that this kind of thing happens quite often: I go to a meeting or conference, expecting the standard presentations, and then get something completely unexpected, new, and exciting! To me, it was most surprising to see how simple some of the concepts are, and yet how useful they might be to learn things about volcanoes! Sometimes, the best ideas are the really simple ones.

Tuesday, 10 March 2015

Volcanic whistles and more

We've been talking about science and being a scientist and girl power for a while, so I reckon it's time to get back to volcanoes. In August 2012 I went to Hawai`i for the AGU Chapman conference on Hawaiian volcanism. The lovely people at the Hawaiian Volcano Observatory (HVO) were nice enough to let me stay for a bit to get familiar with the volcano and to get some of their data to play with. It was also a good opportunity to catch up and collaborate with my friend and colleague Jess Johnson again. My supervisor Mark and I had decided that Kilauea would be a good volcano to study earthquake recordings.
What were we trying to achieve by studying Kilauea Volcano? The main question we had was 

"Do the continuous earthquake recordings look different for different types of eruptions?"


Intuitively one might say, of course there are differences (or at least that's what I would have said). But we wanted some real evidence. Kilauea tends to erupt most of the time, and the style of activity varies, so this was an ideal place for us to go and test our hypothesis. 
I got data from the continuous recordings of earthquake activity around Kilauea volcano for an eruption in the eastern section of the volcano (called the East Rift Zone, close to a crater called Pu'u `O`o) in 2007, and a similar eruption in 2011. These eruptions were related to magma breaking and pushing open a big crack a few kilometres underground. This is called a dike intrusion.
I also got data from a series of more explosive eruptions in the western part of the volcano, close to a crater called Halema`uma`u, in 2008. During the year 2008 these explosive eruptions slowly formed a connection between the magma supply at Kilauea and the surface. Now there is a lava lake that's something like 200 m across, and visitors can no longer access the crater like they used to. The explosions probably only moved magma around that was a few 100 metres below the surface, not kilometres like in 2007 and 2011.
So we had data for two types of eruptions:

fissure eruptions in the east (i.e., lava fountains)


vs. explosive eruptions in the west


We used a technique called Fourier Transforms to find out what frequencies the earthquake waves were composed of at the different points in time (if you want an analogue explanation for what Fourier Transforms do check out this old post). That way we can make what's called a "spectrogram". You can learn a lot of things about the earthquake waves by doing that. For example, you can get an idea if the movement of the ground is from an earthquake that happened close by, or from an earthquake that was hundreds of kilometres away. The graphic below shows the seismic ground movement (the black wiggly thing) and the spectrogram (the rainbow coloured rectangle) for a few days in 2011. I've added some labels to explain in a bit more detail what we can see on it.

Seismic ground movement and "spectrogram" from Kilauea Volcano during an intrusion and fissure eruption. The coloured spectrogram shows how much of each frequency we have in the seismic wave at each point in time. Red means a lot of that frequency, blue means not a so much of that frequency. The red diagonal streaks across the graphic are the volcanic whistles, described below, where the frequency goes up (or down) over time. You can just hear the first one when you listen to the audio from the link in the text below.

So by doing that we learned three main things about eruptions at Kilauea:

1) Fissure eruptions and dike intrusions at Kilauea really do generate ground movement that is different from explosive eruptions.

2) These fissure eruptions and dike intrusions show two phases of ground movement:
Phase I (purple in the graphic above): The first phase is made up of lots of short earthquakes, close to the dike intrusion and the eruption. These earthquakes are probably related to breaking the rocks when the magma pushes open the crack. 
Phase II (blue in the graphic above): The second phase starts a few hours after the first phase. It doesn't have as many short earthquakes, but instead shows continuous (small) movement of the ground for a few days. This continuous movement is what we call "volcanic tremor". Phase II happens quite far away from the eruption and the dike. 

3) The second phase has something called "frequency gliding" (the diagonal streaks in the graphic above). It means that the frequencies of the waves slowly change over time, a bit like a kettle on the stove that starts whistling at a higher and higher tone when the water is boiling.

To give you an idea what I'm talking about I've taken some of the ground movement and sped it up by a lot. You can play the movement that happened over roughly 1 day in just over 1 minute. That way we can actually HEAR the ground move. Click here to listen to the earthquake activity during the 2011 eruption at Kilauea. At first you just hear some noise like the wind. That's before anything is happening. All of a sudden (around 7 seconds in) you start hearing a lot of clicking sounds, maybe like gun shots or like rain drops on a metal roof. Those are the little earthquakes during Phase I. Then it gets a bit quieter again, and then you start hearing something continuous, like a boiling kettle (around 45 seconds). That's the volcanic tremor from Phase II. If you listen really carefully you can even imagine that you're hearing the frequency gliding, i.e., the whistling getting higher and higher.
You may remember a study in 2013 from Redoubt Volcano up in Alaska. Redoubt was also whistling, for around 1-3 minutes before some of the explosions that happened there in 2009. They called it "screams". It turned out that the screams where actually little earthquakes getting closer and closer together in time, until you can't distinguish them anymore and they're just one continuous scream. 
The screaming or whistling at Kilauea is quite different: It's really slow and lasts for many hours. Nobody has seen gliding that lasts this long anywhere before. Also, the little earthquakes that you can hear in the beginning actually SLOW DOWN before the whistling starts, so the explanation from Redoubt doesn't work here. Many other models that explain this type of behaviour can't produce whistling that would last for several hours, so we spent some time exploring what could generate a signal like that. In the end we decided that the Kilauea tremor and whistling may be related to bubbles in the magma: We think that it's possible that gas bubbles in the magma reservoir beneath the western crater Halema`uma`u can form "bubble clouds", or areas where lots of bubbles collect in one place. These bubble clouds can start swinging, or oscillating, if there is magma flow or something else that can start the oscillation. This swinging is transferred into the ground. When the magma flow changes (for example when a crack breaks open somewhere else in the system, like the dikes in 2007 and 2011) the frequency of the bubble cloud tone can change, and produce the whistling that we observe. 
To know whether that is actually what was happening at Kilauea we would need some more info, for example a detailed study of where exactly the whistling was coming from on the volcano. However, it was still really interesting to see how by comparing the earthquake recordings from several different eruptions we were able to identify similarities and differences, and how that - in combination with other observations during those eruptions - made it quite tricky to come up with possible explanations for what we observed. Many studies focus on just one eruption, but we showed that we can learn a lot by looking at the bigger picture.
If you're still reading this you really must have a lot of spare time, so feel free to check out the journal article that we wrote about all this.


Sunday, 5 October 2014

Iceland vs. Japan - the art of eruption forecasting

Finally I'm getting around to writing a new post, after I've taken my summer break since the end of the last term.
Work is in full swing again, undergrads are back, and campus is as busy as ever. After some intense work over the summer I managed to finally submit my manuscript about Hawai`i tremor. Fingers crossed that it gets accepted!
In the meantime, lots of volcano-y things have been happening, so an update is well overdue. Everybody has heard about the eruption of Bárdabunga, of course. We know that a dike (a vertical crack in the rocks, filled with magma) pushed its way through the Earth's crust for quite some time, before it reached the surface and started a stunning fissure eruption. How do we know that? Because lots of earthquakes happened underground where the dike was breaking its way up! But all this is, of course, yesterday's news - and I'm sure many of you have read tons about this eruption and seen some of the spectacular videos and photos.
Another big event was the eruption of Ontake-san last weekend. Pretty much out of the blue this volcano started to erupt explosively - and in the process sadly took many lives. Volcano disaster wise in Japan, this is about as bad as the 1991 eruption of Unzen, which killed over 40 people. After the Ontake eruption some people claimed that the disaster could have been avoided. But the truth is, from what I've seen in terms of data it was very difficult, or maybe even impossible, to see this coming. Why is that?

1. The eruption appears to have been a so-called "phreatic" eruption. That means that instead of magma pushing upwards through the crust, water was seeping into the volcano. This (cold) water probably reached a hotter region underground, where it immediately turned into steam. This steam wanted to rise and expand - it increased the pressure underground which then lead to the explosive eruption. A very similar thing happens in your kitchen: Have you ever heated up a pan or pot without anything in it, and then poured water onto the hot surface? You immediately get a big sizzle and lots of steam.
When scientists analyze the ash from this eruption, they will probably find mostly fragments from old rock that was broken into ash, and probably not many fresh magma pieces. Because no (or very little) fresh magma pushes upwards during these kinds of eruptions usually there aren't many precursors. No large numbers of earthquakes like we had in Iceland just a few weeks earlier, no big changes of the shape of the volcano like there was before the eruption of Mount St. Helens in 1980.

2. That "nothing" was happening on the volcano before the eruption is not 100% true. Since mid September there had been some more earthquakes than usual. However, the highest numbers were recorded on Sep 10 and 11, and they went down again afterwards. Furthermore, these "seismic crises" aren't unusual on volcanoes. Ontake had very similar periods with increased earthquake activity for example in the mid 90s, without eruptions following. Other volcanoes such as Long Valley caldera in California frequently have earthquake swarms - the latest one just a week ago, yet it hasn't erupted in the last 10,000 years or longer. Based on what we know about volcanoes, earthquake swarms CAN mean an eruption is coming, but they don't mean that an eruption HAS to happen. Often other warning signs accompany or follow earthquake swarms, in which cases eruptions become easier to forecast. These other warning signs could be a change on the volcano shape because of magma pushing rock out of the way, or more gases coming out of the volcano. Whereas in Iceland we had some idea what was gonna happen, in Japan we just couldn't see it coming. Despite all our research and efforts, unfortunately we aren't at a point where we can completely understand and forecast the processes happening below our feet in volcanically active areas.

In the case of Ontake, around 10 minutes before the eruption started another earthquake-like signal showed up on the instruments: Volcanic tremor. I've talked about tremor in one of my very early posts, but it might be time for a little update.
Volcanic tremor is a little bit like an earthquake, but with two main differences:
  • Tremor ground oscillations are usually a little bit "slower" than earthquake ground oscillations: Whereas earthquake oscillations go back and forth anywhere between say 1 and 25 or more times per second, tremor oscillations only make it up to 5 or 10 times per second for one full cycle of back and forth.
  • Tremor can go on for a really long time: Whereas earthquakes are usually over after a seconds, tremor can last for minutes, or hours, or days.
Luckily tremor usually only happens very close to the volcano, and the shaking is very small, so people don't usually feel it - otherwise shaking going on for several days or longer might be quite annoying. Yet, we can record these oscillations on our seismometers and usually when we see them we keep a good eye on the volcano to make sure we don't miss any eruption warning signs. Something like 2/3 of all tremor cases happen just before or during eruptions - but that also means that 1/3 of tremor cases don't appear to have anything to do with eruptions. That's why tremor isn't a very reliable warning sign - certainly worth to keep an eye out for but not a unique sign that something is about to happen. Lots of people have had ideas about what causes this tremor signal, but unfortunately many of these studies don't agree with each other, or only work for one specific volcano. In my research I study tremor from volcanoes in lots of different places: Hawai`i, Alaska, Latin America, ... I am trying to find out whether there are different tremor "types", that can tell us more about what causes tremor in different places. That way, maybe one day it will be easier for us to know whether the tremor that we record on our instruments is just harmless, or whether it tells us to get the hell out - and maybe disasters like the Ontake one can be avoided in the future!

What happened at Ontake is certainly worrying - after all there are lots of other volcanoes in the world and other "blue sky eruptions" (i.e. without clear warning signs) might happen elsewhere. Some people here in the Pacific Northwest started to worry a bit, and a radio station got in touch with Mark and me to check whether they could ask some questions in a radio interview. Of course I said yes, after all I love talking about volcanoes and I thought it could be fun. I expected that they would ask me some questions and then cut it and broadcast it at some later point in time. Instead, the whole thing was a 30 minute live interview - which I only realized as we started the interview! Whoops... That made it of course slightly terrifying, after all I hadn't ever given a radio interview. I also felt a little bit weird, sitting alone on the phone in one of our meeting rooms at work and yet talking to anybody who was listening to the radio station at the time. In my surprised state I probably sounded like a complete fool, and most likely made something like 80 out of "100 mistakes scientists make when talking to the media". But what the heck, everybody has to start somewhere, after all! If you're interested you can listen to or download the podcast here - don't judge me too harshly though! Thanks to Cfax 1070 and Terry Moore for hosting me - it was definitely a fun experience :)

Friday, 28 March 2014

Mini series on volcano hazards - part II: From blows to flows...

So last time we talked about the ash the comes out of the volcano when it blows its top. We said that volcanic bombs can be unpleasant when they hit you - to put it mildly. We also discovered that the ash goes up in the air and eventually (slowly) falls back down and creates some serious problems.
Now unfortunately the ash doesn't always slowly come back down to the ground. An ash cloud is a mixture of broken up pieces of magma of different sizes (remember? Ash, lapilli, and bombs), and a bunch of hot gases. The volcano spits out that mixture, and when there is a lot of the hot gases and not quite as much ash the mixture rises up into the air. It can go quite high, and then get transported with the wind and create a big mess for air travel (which we saw happening all the way from Iceland to Europe 4 years ago). Why does the ash cloud rise up so high? In very simple terms it's the same principle as a hot air balloon: The mixture of hot gases and ash is less dense than the surrounding air, so it rises. Sometimes, the amount of ash in the ash cloud is too much though - so the mixture can't rise. Instead it does what every heavy object does when you throw it up into the air: It comes back down, sometimes really really quickly. When this happens we call it a "pyroclastic flow" (from the Greek words for fire and broken in pieces). Check out the video from Earth Uncut TV below to see what a pyroclastic flow looks like.


As you can see in the video, these pyroclastic flows can get quite fast. With speeds of several 100 km/h, they're too fast to drive away from in a car. They're also quite hot: The mixture is almost as hot as the lava that comes of the volcano, something like 600-800˚ C. That's over 3 times hotter than the temperature in your oven when you make pizza. So imagine something that hot hits you at speeds faster than a race car. You can imagine what the outcome would be... In 1991, the Japanese volcano Unzen erupted and created a pyroclastic flow that (in)famously killed over 40 people, including Katia and Maurice Krafft, a couple of volcanologists. 
Has anybody seen the movie Pompeii that came out a few weeks ago (at least in North America, some places in Europe etc might have to wait a bit longer...)? It's based on a true story of a volcanic eruption and a pyroclastic flow of Mount Vesuvius in 79 AD. The pyroclastic flow from that eruption covered the city of Pompeii and everybody in there in several meters of ash. People's bodies were preserved in that ash, and at the historic site in Italy we can still see their casts in the positions they took in the last seconds of their lives that ended so abruptly almost 2000 years ago - a stark reminder of the power of volcanic eruptions.
Below another video (timelapse, by Photovolcanica) of a pyroclastic flow from Sinabung in Indonesia earlier this year. This particular one had a different trigger mechanism - the collapse of part of the volcanic edifice during the eruption. The outcome, however, can be as devastating as the pyroclastic flows generated by ash clouds. In fact, e.g. the Japanese example above was a pyroclastic flow created by a collapse of a part of the volcano.


As we will see next time, pyroclastic flows aren't the only flowing hazards on volcanoes. Water, ash, dirt, and bigger particles can create lahars, and of course lava itself can flow down the slopes of a volcano. But we'll save these topics for another time.

Thursday, 20 February 2014

Mini series on volcano hazards: Ash and more

Since I was talking about eruption forecasting in the last post I think it's time to talk a bit about why we even care. Ok, we all know that volcanic eruptions can be dangerous, and that people like me are trying to understand them better, but what specifically can be a hazard during or after an eruption?
This is going to be a mini series - each post will cover a new hazard. So let's start with a very obvious one: Volcanic ash, lapilli, and bombs. What do these terms mean?
Explosive eruptions usually send pieces of rock into the air. All of the pieces smaller than 2 mm diameter are called ash. Everything between 2 mm and 6.4 cm is called lapilli, and everything larger than that is called volcanic bombs. Look at the photo below to see an explosion with a bunch of ash and some really large bombs.
The smaller the piece the further it can get away from the volcano - either because of the explosive power of the eruption, or because it gets carried away by wind in the atmosphere. Bombs are really dangerous when you're close to volcanic eruptions - it's probably not very healthy to get hit in the head with a 10 cm or so potentially hot rock that comes flying through the air. 
Explosive eruption at Sakurajima Volcano, Japan, Jul 2013. You can see an ash cloud rising. Can you spot the bombs at the bottom right of the ash cloud? Look at the size of the trees and the mountain, and estimate how large the bombs must be. Definitely wouldn't wanna get too close! Photo: K.Unglert

Ash is obviously also a problem close to the volcano: Imagine a huge sandstorm, but in addition particles in the ash are often also hot, and covered with acids from the gases in the eruption. Getting that in your eyes is inconvenient at best, and once you get the fine particles in your nose or lungs it only goes downhill. If you're exposed to ash from volcanic eruptions for a long time (e.g. many years living close to an erupting volcano) it can cause significant health issues. One way to make it at least a little bit better is to wear a mask that covers your face.
Unfortunately that's not the end of it. Even small layers of fine ash on e.g. air conditioning or air plane turbines cause the parts to corrode really fast - that's why airspace usually gets closed off around volcanic eruptions. Remember the eruption of Eyjafjallajökull in Iceland in 2010? Very fine ash particles got blown towards Europe and a lot of people were stranded in airports for days. 
Now imagine ash fall onto the roof of your house: Even a small layer, say 5 cm, can be really dangerous. Why? Well, ash - just like sand - is just tiny pieces of rock. If your roof is 10 m x10 m and has a 5 cm layer of ash on it that's a total volume of 5 cubic meters. Rock has a density of approximately 2600 kg per 1 cubic meter, so 2600 times 5 is? That's right, really really heavy! Even if the ash isn't as dense (and thus heavy) as solid rock, thin layers of ash add up to a heavy weight quite quickly. That makes building collapse a big danger.
Last but not least, there can be impacts on the economy. Ash fall covering crops can cause entire seasons to be without harvest, and animals don't find plants to feed from. Below is a photo of flowers covered in ash at Sakurajima Volcano, Japan, to give you an idea of what the ash can do. Now imagine thicker layers of ash from a bigger eruption!
Flowers covered in ash after a small explosive eruption at Sakurajima Volcano, Japan, Jul 2013. This was only a small eruption, so imagine what it must be like after a large explosive eruption! Photo: K.Unglert
Now we've learned about the main dangers of ash, lapilli, and bombs being thrown out of volcanic vents during an eruption. When the ash is a bit too heavy too rise, or when the ash and the bigger pieces build up over time, they can cause more hazards (pyroclastic flows and lahars), but we're gonna hear about those another time!

Thursday, 6 February 2014

Back with a BANG: Volcanoes 2014 and eruption forecasting?

Finally the silence is over. Happy New Year to everybody - we're just gonna ignore the fact that it's already Feb 6th.
I'm gonna start the year with an issue that has come up quite a bit lately when talking with friends and family... Eruption forecasting. Yep, I said it, the dreaded term. Sad events like 15 deaths due to the latest activity at Mt. Sinabung in Indonesia bring the forecasting topic into the focus of the public from time to time. 
Embedded image permalink
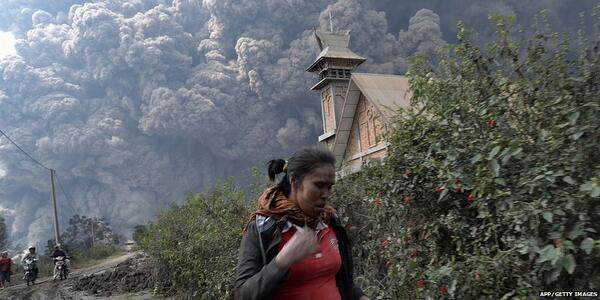
Most recent eruption at Mt. Sinabung, Indonesia, Feb 1, 2014. Image from Twitter, @BBCBreaking.

So let's look into this a bit more. We're gonna learn about what signs of volcanic activity there are are at the surface, what we can do to monitor them, and what the difficulties with forecasting are.

To explore this topic in the detail it deserves, however, we need to start with something very basic: The difference between "forecast" and "prediction". If you look up the two words in a dictionary you will most likely find little difference between their meanings, often they're even listed as synonyms of each other. In science, however, things are a little different. In particular, in seismology (the study of earthquakes) the two terms have very distinct meanings: A "forecast" assesses the likelihood of an earthquake of a certain magnitude in a given area and time span, e.g. "there is a 1 in 10 probability that a magnitude 7 earthquake will occur in the Pacific Northwest in the next 100 years" (and of course I made this one up). A prediction, in contrast, is much more specific than that, e.g. "a magnitude 7 earthquake will occur within 100 km of Vancouver on Mar 15 at 10:45 AM" (again, obviously I'm making these things up. Yes, my imagination is just wild today.). In seismology, earthquake forecasting is done quite commonly, whereas the general scientific consensus is that earthquake prediction is currently (and might always be) impossible (despite some individuals or groups claiming otherwise...). 

So back to volcanoes. In volcano monitoring, people generally don't make "predictions" for when an eruption will occur. Instead, there are short-term forecasts (compared to the long-term forecasts that are usually given in seismology). These forecasts depend on how volcanic activity evolves over time. So what do we use to determine what our volcano is doing? Just like a patient in a hospital might be hooked up to a bunch of instruments measuring vital signs like heart rate, oxygen levels, and body temperature, our volcano is usually hooked up to a bunch of scientific instruments. The vital signs of a volcano are called "precursors", they are for example:
  • Earthquakes - we usually look at how many there are say per day or hour, how big they are, at what depth they occur and whether that depth (and horizontal location) changes, and what "type" of earthquake they are. Types of earthquakes might be "regular" earthquakes with (relatively) high frequency waves, earthquakes with (relatively) low frequency waves, a mixture between the two (so-called "hybrids"), or volcanic tremor. These different types of earthquakes sometimes show how magma is moving from one place to another.
  • Deformation - how the surface of the volcano changes its shape. We use instruments on the ground and satellites images to determine whether the surface is moving upwards and inflating like when you're blowing up a balloon, or deflating like when you let the balloon go. The deformation usually happens because of a change of pressure below the ground.
  • Gases - volcanoes spit out gases in different places most of the time. The gases come - in one way or another - from the magma below the ground. The amount of gases, their temperature, and their type (e.g. sulfur dioxide or carbon dioxide) can help us to determine whether magma might be getting closer to the surface.
  • Temperature - sometimes we see higher temperatures around volcanoes on satellite images.
Usually, when we see more earthquakes per hour, a lot of deformation, a lot of gases, and high temperatures, we become worried that magma might be getting close to the surface and ready to cause an eruption. This is what we call "unrest". Volcano observatories use alert or hazard levels to put a number on the state of volcano unrest. Below are examples of two different alert/hazard level systems from two different volcano observatories (GeoNet, New Zealand; and Montserrat Volcano Observatory, Lesser Antilles):
Alert levels for frequently active volcanoes in New Zealand (courtesy of GeoNet)

Hazard levels for Soufrière Hills Volcano, Montserrat (courtesy of Montserrat Volcano Observatory)
You can see that Montserrat has zones in addition to the hazard levels, and access to the zones is controlled based on what the hazard level is. The way the alert/hazard level is determined depends on the observatory and the specific volcano. The assessment is based on what is known from previous eruptions, scientific studies, and sometimes from other volcanoes.

So far so good. So we now know that a volcano has vital signs like a person, and that we might be able to use them to tell us whether an eruption might be happening soon or now. But of course, things aren't that simple. Unfortunately, volcanoes are like people in another sense (not just in terms of the vital signs analogy): Sometimes they have their own mind, behave in ways that can't be anticipated, and surprise us all. Also, many volcano may look similar but have quite different behaviours from one to another. For example, on some volcanoes precursors build up over weeks or months, whereas on other volcanoes we get only short or no warning at all. Whereas many volcanoes have MORE earthquakes just before an eruption, Telica Volcano in Nicaragua, for example, sometimes goes quiet and has no more earthquakes within an hour or so before explosions (listen to Mel Rodger's recent podcast on this). Similarly, whereas many volcanoes inflate before eruptions, Uturuncu Volcano in Bolivia has been inflating quite a lot for over 10 years without an eruption (read James Hickey's blogpost on this).
And just like we have good days and bad days, even one volcano can change its behaviour from one eruption to the next. Obviously in that case we're gonna have a hard time making a good forecast. 

Furthermore, the situation is complicated by people. One would think that it's always better to be safe than sorry, so ideally we would move everybody who lives close to a volcano to a safe place? Obviously that's quite unrealistic. Some countries have so many volcanoes that there simply would be no space at all to put people: On the website of the Global Volcanism Program, a search for volcanoes in Indonesia returns 1182 matches. Granted, some of them might be individual cones on one bigger volcano, or synonyms for different craters and cones, but the number is still really really large if we were to take those duplicates out. Where would we move all the people living close to those volcanoes? We also can't just take them away from their homes, the places where they grew up, away from their property, their fields, their places of income. Even evacuating an area can have significant economic losses the longer it lasts (ignoring the obvious potential loss of life and damage to the economy through the eruption itself). To make things even more complicated, there's the famous "cry wolf" phenomenon. People tend to become less responsive to evacuation orders or instruction for precaution if they have experienced several scenarios in which no eruption occurred in the end. In other words, if you cry wolf too often nobody will believe you anymore.

We can see now that it's quite difficult to give good eruption forecasts. The volcanoes can give us hints, but ultimately we might never know for sure what's going to happen. As scientists, in many cases, we are advising decision makers from a purely scientific perspective with what we know about a volcano and its state. Ideally, there is a dialogue between scientists and decision makers, who will then have to take into account economic, psychological, and other considerations to make a call for evacuation or against it. In Indonesia at Sinabung, on Friday authorities decided to let people back into the area (but with a certain distance to the volcano) after 10s of thousands had been evacuated following eruptions in the previous weeks. Clearly they did not anticipate the eruption that happened just one day later. A fairly large eruption at Tungurahua Volcano, Ecuador, which also happened on Saturday, thankfully appears to have had a less fatal outcome than the one in Indonesia. In the end, the outcomes of an eruption depend on many factors. As scientists, we are doing our best to study the processes happening on volcanoes. We might not make huge leaps, but every project is a little step towards understanding our volcanic neighbours a little bit better, and maybe make forecasting a tiny bit more reliable.